Debugger plugin
RmlUi ships with a visual debugger plugin that you can use and modify to aid you in development. You can try it out on all the included samples, such as the Rocket Invaders from Mars application, by pressing F8.
Tools
The tools included with the debugger are the following.
Event log
The debugger puts in its own system interface layer to intercept the logging messages going out of RmlUi. The log beacon (a little exclamation mark) will become visible in the top-right corner of its context when a new log message has been sent. You can open the log by clicking on the beacon or opening the debugger and clicking on the Event Log button.
Outline renderer
If you click on the Outlines button on the menu, the debugger will render red outlines around the bordered area of every element in the target context.
Element info
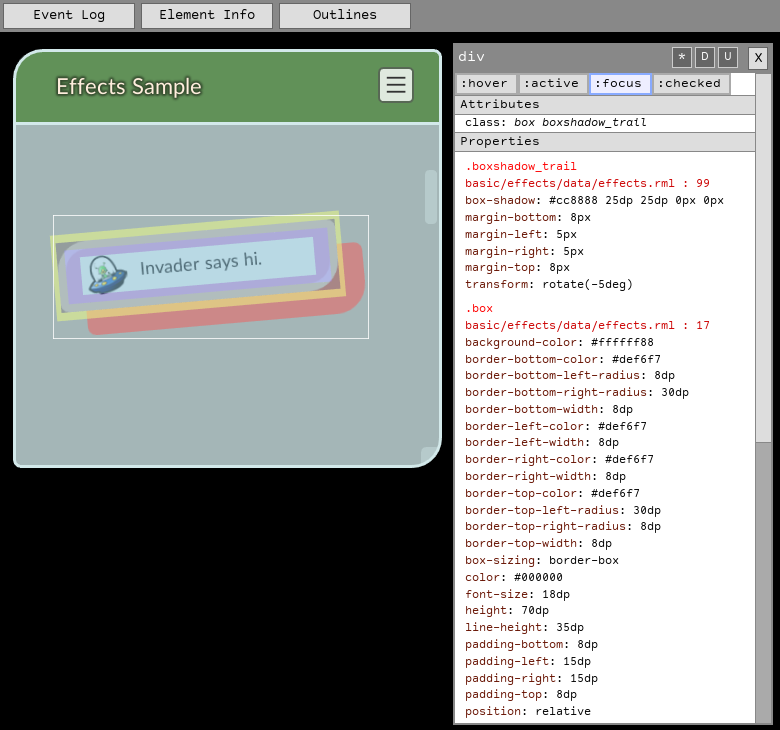
If you click on the Element Info button the menu, the visual debugger will open. When this is open, mouse clicks on the target context will be intercepted; any element clicked on will become the debugger’s active element. The debugger will show the following about the active element:
- The element’s debug area painted directly on top of it: The content area (blue), padding (purple), border (grey), margin (yellow), and bounding box for the paint area (white outline).
- The element’s attributes.
- The element’s properties, and where they were declared.
- The position and size of the element’s primary box.
- The full box model sizes, listed as:
box-x (px): margin-left|border-left|padding-left <content> padding-right|border-right|margin-rightbox-y (px): margin-top|border-top|padding-top <content> padding-bottom|border-bottom|margin-bottom
- The ancestors of the element.
- The children of the element.
If the debugger picks up another click on the active element, the click will fall through to the element itself.
The element info dialog has some settings that can be toggled:
*Select elements. When this setting is disabled, the debugger will no longer intercept mouse clicks in the document, keeping the info on the currently selected element.DDraw element dimensions. Toggle to enable or disable drawing the debug area of the selected element.UUpdate info continuously. When enabled, the listed properties of the element will be refreshed automatically.
All settings are enabled by default.
As these tools are all open source, we encourage you to add more features if you find the debugger doesn’t give you the information you need. You can find the source for the debugger plugin in the Source/Debugger/ directory within your RmlUi installation.
The following image shows the debugger in action. An element is selected, its debug area is painted on top of it, and its properties and other useful information are listed to the right.
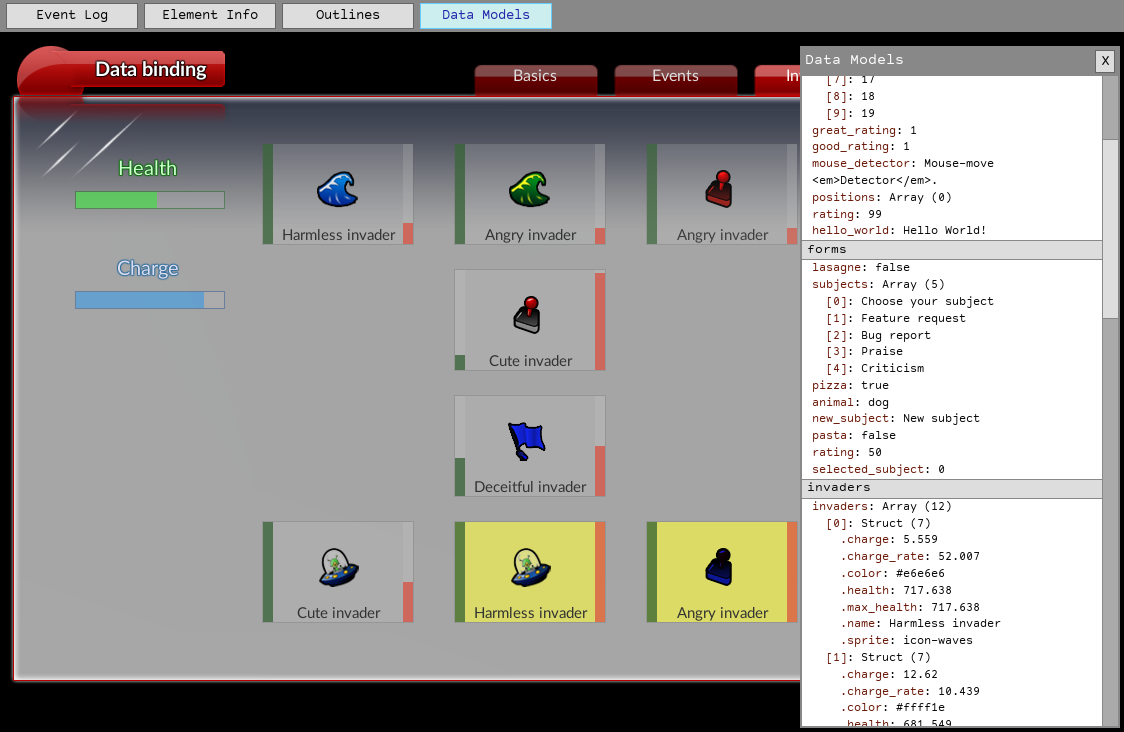
Data models
When clicking the Data Models button, the data models window opens up. This window allows inspecting the values of all data variables in the data models of the context being debugged. The data variables are sectioned by each data model.
Initialisation
To integrate the debugger into your application, link with rmlui_debugger or the imported CMake target RmlUi::Debugger. Then, include <RmlUi/Debugger.h> in a source file.
To start the debugger, call Rml::Debugger::Initialise() with the context you want the debugger menu rendered into.
// Initialises the debug plugin. The debugger will be loaded into the given context.
// @param[in] context The RmlUi context to load the debugger into.
// @return True if the debugger was successfully initialised
bool Initialise(Rml::Context* context);
The debugger’s context is not necessarily the context being debugged, only the context it renders its elements into. When the debugger is initialised, however, it automatically begins debugging its context.
Debugging another context
To debug another context, call the Rml::Debugger::SetContext() method.
// Sets the context to be debugged.
// @param[in] context The context to be debugged.
// @return True if the debugger is initialised and the context was switched, false otherwise.
bool SetContext(Rml::Context* context);
The debugger will then be ready for debugging elements in the new context.
Controlling visibility
The IsVisible() and SetVisible() functions can be used to control the visibility of the debugger’s elements.
// Sets the visibility of the debugger.
// @param[in] visibility True to show the debugger, false to hide it.
void SetVisible(bool visibility);

// Returns the visibility of the debugger.
// @return True if the debugger is visible, false if not.
bool IsVisible();
Shutting down or restarting
The debugger can be shutdown manually if desired using Rml::Debugger::Shutdown().
// Shuts down the debugger.
// @return True if the debugger was successfully shut down
void Shutdown();
The shutdown will automatically be handled during the call to Rml::Shutdown() so typically it does not need to be called. However, it can be useful it you want to re-initialise the debugger in another host context. After the shutdown it is possible to call Rml::Debugger::Initialise() to start the debugger again.